Saturday, 30 November 2024

CNC Machining Feed Rate for Material Surface Finish in Ra using Scilab

Topic: Turning (Lathe) Feed Rate Calculation for a given Average Roughness;

Subject: Machine Shop Technology;

Tool: Scilab;

By: Gani Comia, Nov. 2024;

Average Roughness, or Ra, is a parameter to measure the surface finish of a workpiece. Ra is typically expressed in micrometers \( \mu m \). Shown here are some of the common Ra values for different surface finishes:

  • Polished; Ra 0.05~0.2 \( \mu m \)
  • Machined (Finish): Ra 0.8~3.2 \( \mu m \)
  • Machined (Rough): Ra 3.2~12.5 \( \mu m \)
  • Casted: Ra 12.5~50 \( \mu m \)
In turning metal workpieces, feed rate, f (mm/rev), is one of the considerations to achieve the required surface finish. Let us say we wanted to achieve an Ra 3.2 \( \mu m \) and we have two types of insert, round and rhombic. The machining parameter, which is feed rate, can be calculated and used in the CNC turning program. Below is the basis for calculating feed rate in mm/rev and its Scilab script.

$$f\;=\;{2}\;{\sqrt{\frac{r\;R_a}{125}}}$$


Scilab Script

// Machining Feed Rate Calculation in CNC Turning
// Gani Comia, Jan. 2023
clear;clc;

// given insert type and corner radius
// round corner, r=6.35 mm, rhombic corner, r=0.2 mm
r = [6.35 0.2];                                 // mm
// standard Ra, surface finish
Ra_std = [0.1 0.2 0.4 0.8 1.6 3.2 6.3 12.5];    // um
Ra = linspace(0.1,12.5,200);                    // um

// formula feed/rev for insert radius and Ra requirement
function f=feedPerRev(r, Ra)
    f = 2.*sqrt(r.*Ra./125);  // mm/rev, feed per rev
endfunction

// calculation of feed rate for standard Ra
f_std_round = feedPerRev(r(1), Ra_std);
f_std_rhombic = feedPerRev(r(2), Ra_std);
// table of feed rate for standard Ra
mprintf("\n Ra(um)\t\tf(mm/rev) Round\tf(mm/rev) Rhombic\n")
Table = [Ra_std' f_std_round' f_std_rhombic'];
mprintf("\n %3.2f \t\t %3.3f \t\t %3.3f\n", Table)

// calculation of feed rate from 0.1 to 12.5 um, Ra
f_round = feedPerRev(r(1), Ra);
f_rhombic = feedPerRev(r(2), Ra);

// plotting results
clf;
plot(Ra, f_round, "b-", "linewidth", 1.5)
plot(Ra, f_rhombic, "r-", "linewidth", 1.5)

title("CNC Lathe Feed Rate for Surface Finish")
xlabel(["Average Roughness", "$\Large{R_a\,\;(\mu\,m)}$"])
ylabel(["Feed Rate", "$\Large{f\,\;(mm/rev)}$"])
legend(["Round r = 6.35 mm", "Rhombic r = 0.2 mm"],2)

// case scenario for Ra=3.2 um
Ra_32 = 3.2;
f_round_32 = feedPerRev(r(1), Ra_32);
f_rhombic_32 = feedPerRev(r(2), Ra_32);

// line plot of special concern
xpt_ver = [3.2 3.2]; ypt_ver = [0 f_round_32];
plot(xpt_ver, ypt_ver, "g--")
xpt_hor = [3.2 0]; ypt_hor = [f_round_32 f_round_32];
plot(xpt_hor, ypt_hor, "g--")
xpt_hor_1 = [3.2 0]; ypt_hor_1 = [f_rhombic_32 f_rhombic_32]
plot(xpt_hor_1, ypt_hor_1, "g--")

// plotting points
plot(Ra_32, f_round_32, ".b")
xstring(0.1, f_round_32, ["$\large{f\;=\;0.806\;mm/rev}$"])
plot(Ra_32, f_rhombic_32, ".r")
xstring(0.3, f_rhombic_32, ["$\large{f\;=\;0.143\;mm/rev}$"])
xstring(3.2, 0.30, ["$\Large{R_a\;=\,3.2\;\mu\;m}$"], -90)

Visualization of the relationship of f and Ra for a given nose radius, r, in turning machining is a helpful guide for machinist reference. 

Fig. 1. Turning Feed Rate for Insert Type and Surface Finish.

This toolbox can be your handy reference to calculate the turning feed rate as the initial machining parameter in the CNC program.

Feel free to comment for inquiry, clarification, or suggestion for improvement. Drop your email to request the softcopy of the file.

Disclaimer: The formulas and calculations presented are for technical reference only. Users must verify accuracy and ensure compliance with applicable engineering standards, codes, and safety requirements before practical application.


Monday, 25 November 2024

Numerical Differentiation using Central Difference Method with Python

Topic: CDM of Numerical Differentiation;

Subject: Numerical Method;

Tool: Python;

by: Gani Comia, Nov. 2024;

Numerical differentiation is a method to approximate the derivative of a function using discrete data points. This is applicable for a set of data points or having a function that is difficult to differentiate analytically. There are three common methods of numerical differentiation.

The central difference method is generally more accurate as it considers the function values on both sides of the independent variable. The toolbox presented here is the Python script of numerical differentiation using CDM. The plot is generated for both the given function and its derivative for comparison.

Python Script

# -*- coding: utf-8 -*-
"""
Created on Tue Jun 22 19:17:34 2021
@by: Gani Comia
"""

'''
This is an example plotting script of a function and its derivative
using the central difference method (CDM) of numerical differentiation
with the use of Python.

Function:  f(x) = exp(-x^2)
Derivative:  f'(x) = (f(x+h) - f(x-h)) / 2h
'''

import numpy as np
import matplotlib.pyplot as plt

# Given: domain and the function, f(x)
x = np.linspace(-5,5,1000)            # domain from -5 to 5
f = np.exp(-x**2)                           # f(x)

# Approximation of derivative, f'(x), using numerical differentiation
h = 0.001                                      # step size
df = np.zeros(1000,float)              # initialization

# Numerical differentiation using CDM
# Note: x is replaced with x[i] and added with +h and -h
for i in np.arange(1000):
    df[i] = (np.exp(-(x[i]+h)**2) - np.exp(-(x[i]-h)**2)) / (2*h)

# Plot of f(x) and f'(x)
plt.plot(x, f, label="f(x)")
plt.plot(x, df, label="f'(x)")
plt.title("Plot of f(x) and f'(x) of $e^{(-x^2)}$")
plt.xlabel("x-value")
plt.ylabel("f(x) and f'(x)")
plt.legend()
plt.show()


Visualization of the given function and its derivative.


Fig. 1. Plot of the function and its derivative.


This kind of script can be saved and rerun to solve similar engineering problems. Python IDEs such as Thonny, Spyder, Jupyter NB, and Google Collab can be used to execute the script.

Feel free to comment for inquiry, clarification, or suggestion for improvement. Drop your email to request the softcopy of the file.

Disclaimer: The formulas and calculations presented are for technical reference only. Users must verify the accuracy and ensure compliance with applicable engineering standards, codes, and safety requirements before practical application.


Sunday, 24 November 2024

Mechanical Vibration Measurement using Accelerometer and Scilab

Topic: Vibration Detection and Measurement;

Subject: Mechanical Vibration;

Tool: Phyphox and Scilab;

By: Gani Comia, Nov. 2024;

A vibrating object is said to be moving and accelerating.  Accelerometer sensors, a device that measures the acceleration of an object, are used to detect the mechanical vibration. The Phyphox app, an application that can be installed in an Android or IOS phone, can access your phone’s sensor to measure acceleration. It has the capability to store and download the acceleration data in the .csv file used for numerical analysis.

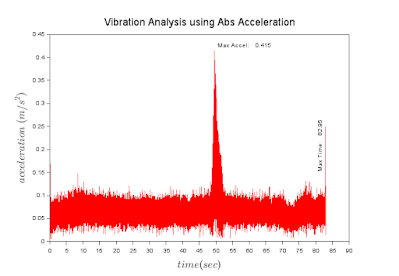
Here is the Scilab script for visualization of the example downloaded data from the Phyphox app.  The app’s acceleration data is organized into five columns: time, accel x-axis, accel y-axis, accel z-axis, and accel abs.  An example plot of the time and accel abs (absolute acceleration) and its script are presented.

Scilab Script

// Plotting data from accelerometer using Phyphox & Scilab
// by: Gani Comia, Aug. 2024
clear;clc;

// extracting data
clear importdata;

function [data]=importdata(filename)
    data = csvRead(filename, ",", ".", "double")
endfunction

[A] = importdata("accelerometerData.csv");

// assigning variable name
time = A(:,1);
accel_x = A(:,2);
accel_y = A(:,3);
accel_z = A(:,4);
accel_abs = A(:,5);

maxTime = max(time);
maxAccel = max(accel_abs);
disp(maxTime,maxAccel)

// plotting acceleration data
clf;
f=gcf();
f.figure_size=[700,600];
plot(time,accel_abs,"red")
title("Vibration Analysis using Abs Acceleration","fontsize",4)
xlabel("$time (sec)$","fontsize",4)
ylabel("$acceleration\;(m/s^2)$","fontsize",4)

// displaying information
format("v",6)
xstring(50,maxAccel,["Max Accel:", string(maxAccel)])
xstring(maxTime,0.15,["Max Time:", string(maxTime)],-90)

Executing the script will give you the plot for visualization of the acceleration data.

The Scilab simulation tool facilitates visualization of numerical data, as in this case the acceleration of the vibrating object. Further numerical analysis to determine the velocity, displacement, and frequency of vibration can be done as well using the tool.

Feel free to comment for inquiry, clarification, or suggestion for improvement. Drop your email to request the softcopy of the file.

Disclaimer: The formulas and calculations presented are for technical reference only. Users must verify the accuracy and ensure compliance with applicable engineering standards, codes, and safety requirements before practical application.
Visualization of Mach Number at Supersonic and Sonic Speeds

Topic: Mach Number Subject: Fluid Mechanics Tool: Scilab By: Gani Comia, October 2025 Definition of Mach Number The Mach number ...