Topic: Vibration Detection and Measurement;
Subject: Mechanical Vibration;
Tool: Phyphox and Scilab;
By: Gani Comia, Nov. 2024;Here is the Scilab script for visualization of the example downloaded
data from the Phyphox app. The app’s
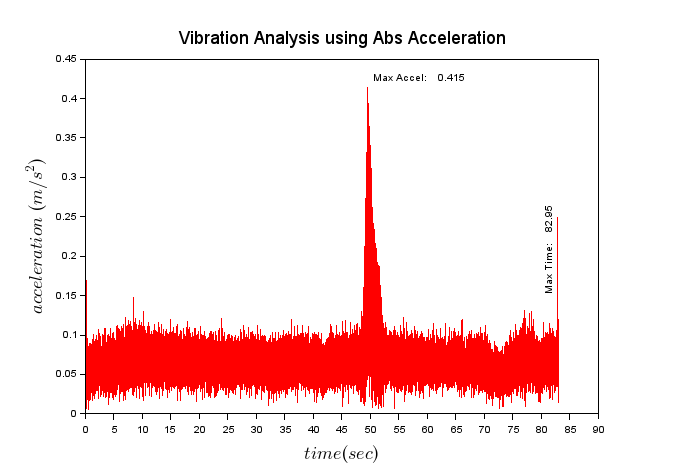
acceleration data is organized into five columns: time, accel x-axis, accel
y-axis, accel z-axis, and accel abs. An example
plot of the time and accel abs (absolute acceleration) and its script are presented.
Scilab Script
// Plotting data from accelerometer using Phyphox & Scilab
// by: Gani Comia, Aug. 2024
clear;clc;

// extracting data
clear importdata;

function [data]=importdata(filename)
    data = csvRead(filename, ",", ".", "double")
endfunction

[A] = importdata("accelerometerData.csv");

// assigning variable name
time = A(:,1);
accel_x = A(:,2);
accel_y = A(:,3);
accel_z = A(:,4);
accel_abs = A(:,5);

maxTime = max(time);
maxAccel = max(accel_abs);
disp(maxTime,maxAccel)

// plotting acceleration data
clf;
f=gcf();
f.figure_size=[700,600];
plot(time,accel_abs,"red")
title("Vibration Analysis using Abs Acceleration","fontsize",4)
xlabel("$time (sec)$","fontsize",4)
ylabel("$acceleration\;(m/s^2)$","fontsize",4)

// displaying information
format("v",6)
xstring(50,maxAccel,["Max Accel:", string(maxAccel)])
xstring(maxTime,0.15,["Max Time:", string(maxTime)],-90)
Executing the script will give you the plot for visualization of the acceleration data.
The Scilab simulation tool facilitates visualization of numerical data, as in this case the acceleration of the vibrating object. Further numerical analysis to determine the velocity, displacement, and frequency of vibration can be done as well using the tool.
Feel free to comment for inquiry, clarification, or suggestion for improvement. Drop your email to request the softcopy of the file.
Disclaimer: The formulas and calculations presented are for technical reference only. Users must verify the accuracy and ensure compliance with applicable engineering standards, codes, and safety requirements before practical application.
No comments:
Post a Comment